> ## Documentation Index
> Fetch the complete documentation index at: https://docs.iru.com/llms.txt
> Use this file to discover all available pages before exploring further.
# Detections ページについて
> Iru Endpoint の Detections ページの使い方を説明します。ダッシュボードのウィジェット、フィルタ、検知テーブル、脅威の詳細ビュー、デバイスレコードの検知を確認します。
このガイドは Mac コンピュータおよび Windows コンピュータに適用されます
### Detections ページについて
Iru Endpoint Web App の **検出** ページでは、EDR Library Item が割り当てられたデバイスについて、管理者が脅威イベントを確認し、傾向を監視し、対応アクションを実行できます。左側のナビゲーションバー(**Endpoint** の下)で **検出** を選択してアクセスします。
EDR の機能とポスチャモードの概要については、[Endpoint Detection & Response(EDR)の概要](/ja/endpoint/endpoint-detection-response-edr/endpoint-detection-and-response-edr-overview)を参照してください。
### ダッシュボードのウィジェット
#### Detections Over Time
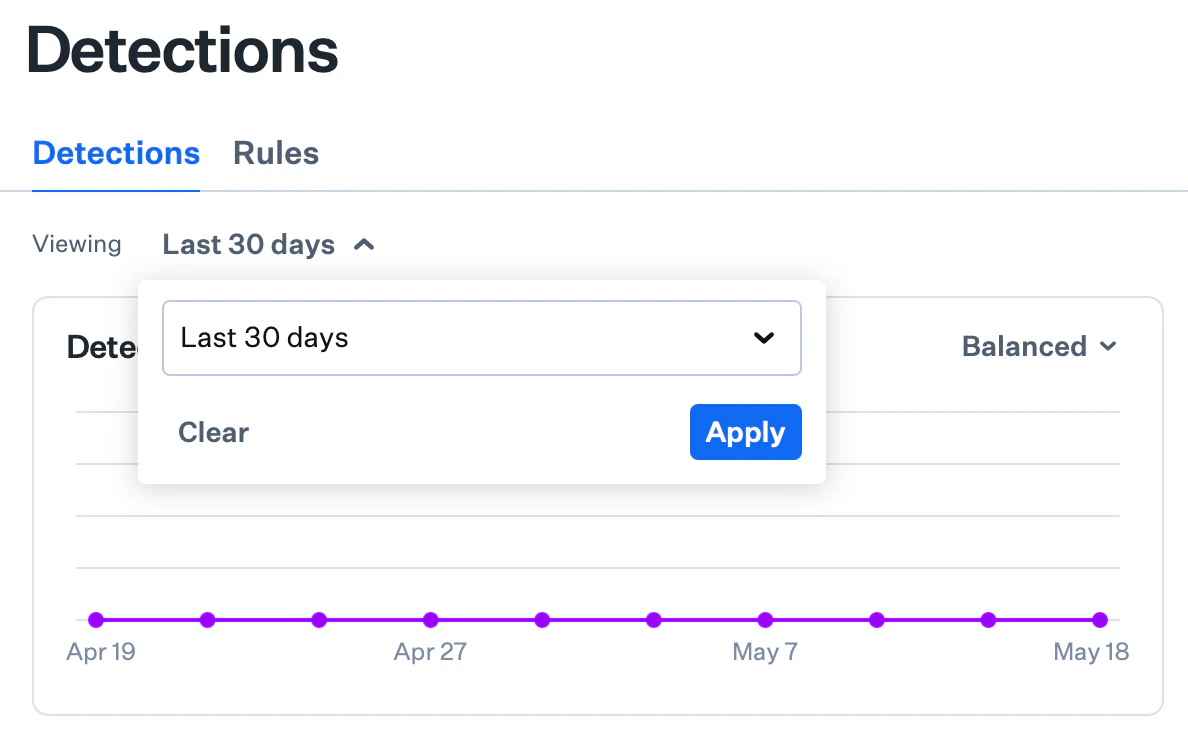
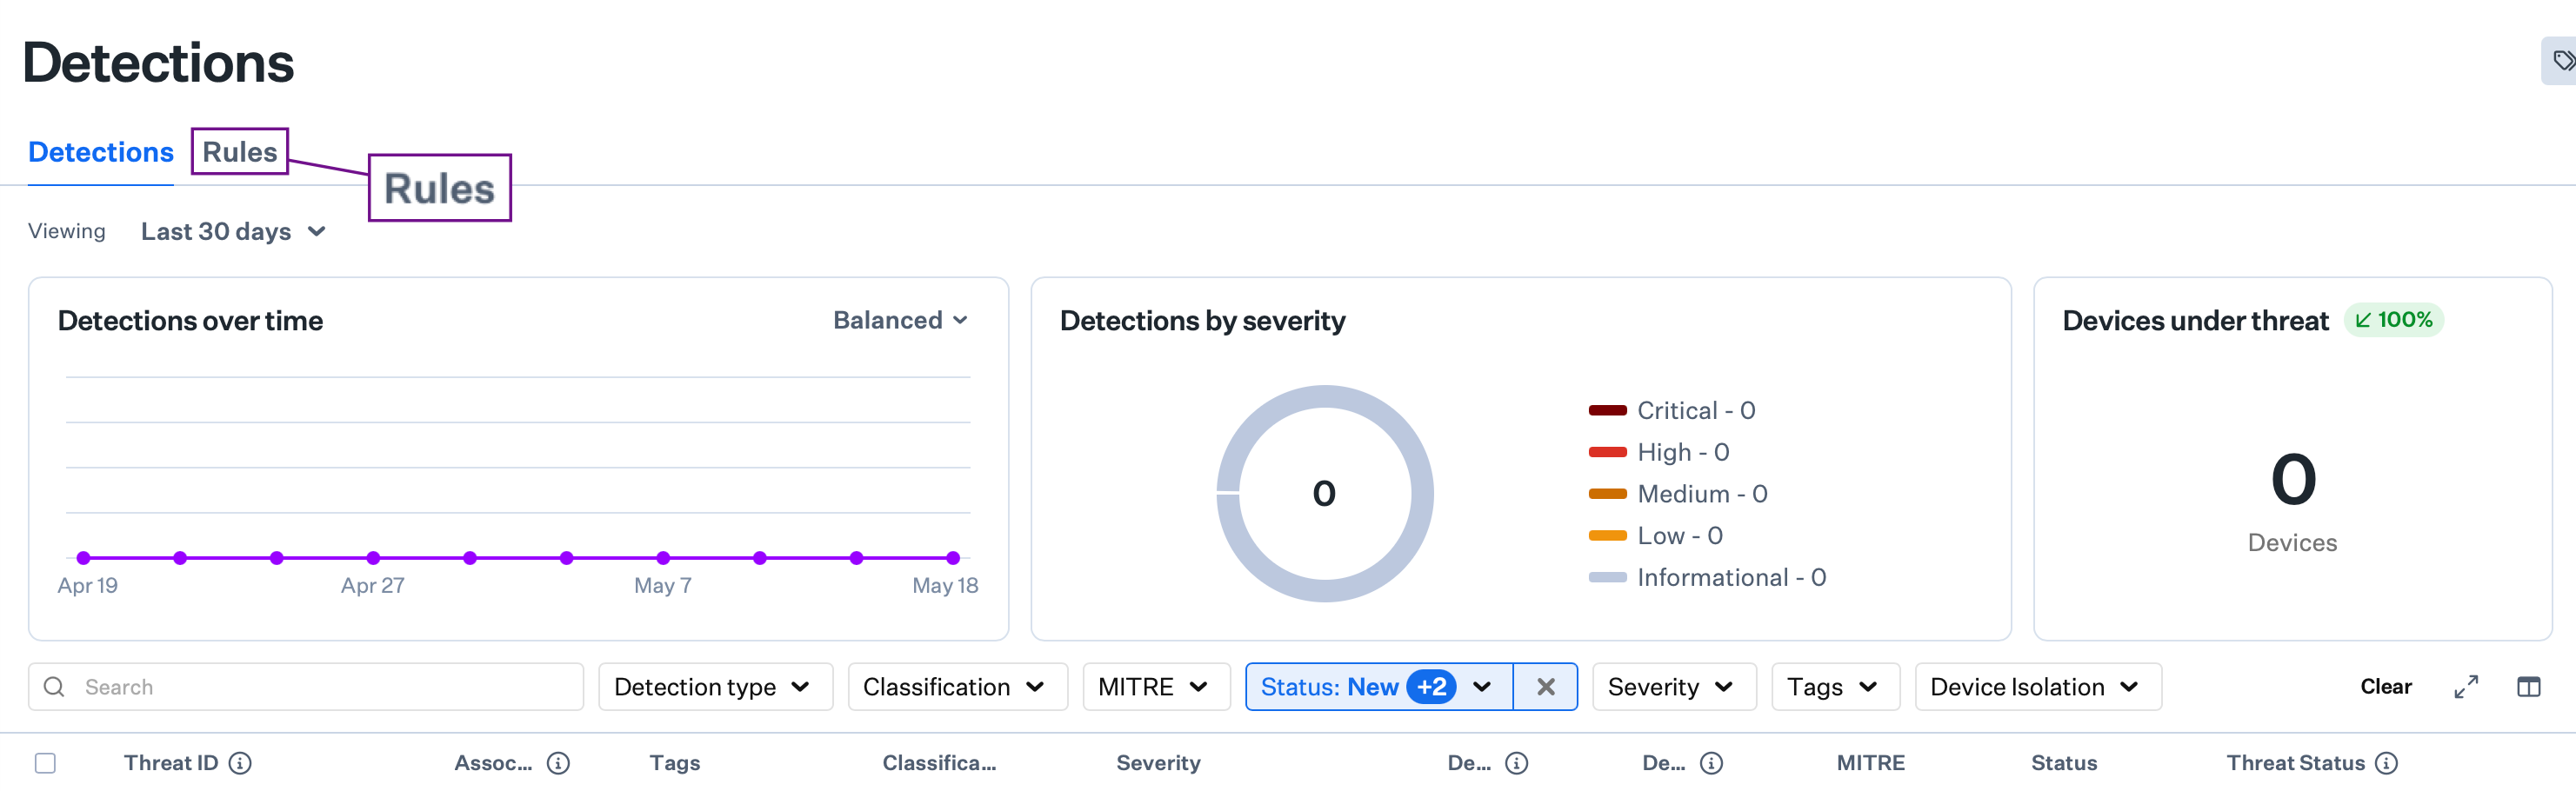
**Detections Over Time** グラフには、指定した期間内に検知されたセキュリティ脅威の時系列の概要が表示されます。デフォルトでは、グラフには過去 30 日間のデータが表示されます。**検出** タブの上部で、**Viewing** の横にある期間(デフォルトは **Last 30 days**)を選択すると、**Last 24 hours** から **Last 90 days**、**All time**、**Custom date range** などに期間を変更できます。
90 日を超える期間を選択した場合、表示は自動的に 90 日に制限されます。
グラフには 3 つの表示オプションがあります。
* **Granular:** 個々の脅威の検知をすべて表示します
* **Smooth:** 全体的な傾向とパターンを表示します
* **Balanced:** 詳細なデータと傾向の表示の中間となるデフォルトの設定です
 #### Detections By Severity
**Detections By Severity** ビューには、重大度レベル別の検知の内訳が視覚的に表示されます。各検知には、Critical、High、Medium、Low、Informational の 5 つの重大度レベルのいずれかが割り当てられます。
#### Detections By Severity
**Detections By Severity** ビューには、重大度レベル別の検知の内訳が視覚的に表示されます。各検知には、Critical、High、Medium、Low、Informational の 5 つの重大度レベルのいずれかが割り当てられます。
 #### Devices Under Threat
**Devices Under Threat** の指標には、現在アクティブなセキュリティ脅威があるデバイスの数が表示されます。ページ上部の期間を使用して時間枠を調整します。このデータはページが読み込まれるたびに更新されます。
#### Devices Under Threat
**Devices Under Threat** の指標には、現在アクティブなセキュリティ脅威があるデバイスの数が表示されます。ページ上部の期間を使用して時間枠を調整します。このデータはページが読み込まれるたびに更新されます。
 #### 期間でフィルタする
**検出** タブで、ページ上部の期間を選択して、どこまで遡って脅威イベントを表示するかを選択します。現在の期間は **Viewing** の右側に表示され、デフォルトは **Last 30 days** です。プリセット(**Last 24 hours**、**Last 7 days**、**Last 30 days**、**Last 60 days**、**Last 90 days**、**All time**)を選択するか、**Custom date range** を選択して特定の開始日と終了日を指定します。選択した内容は、ダッシュボードのウィジェットと検知テーブルに適用されます。
#### 期間でフィルタする
**検出** タブで、ページ上部の期間を選択して、どこまで遡って脅威イベントを表示するかを選択します。現在の期間は **Viewing** の右側に表示され、デフォルトは **Last 30 days** です。プリセット(**Last 24 hours**、**Last 7 days**、**Last 30 days**、**Last 60 days**、**Last 90 days**、**All time**)を選択するか、**Custom date range** を選択して特定の開始日と終了日を指定します。選択した内容は、ダッシュボードのウィジェットと検知テーブルに適用されます。
 ### 検索、フィルタ、検知テーブル
検知テーブルの上にある **検索** とフィルタのドロップダウンを使用して、検知の種類、分類、ステータス、重大度、その他の条件でリストを絞り込みます。
### 検索、フィルタ、検知テーブル
検知テーブルの上にある **検索** とフィルタのドロップダウンを使用して、検知の種類、分類、ステータス、重大度、その他の条件でリストを絞り込みます。
 **Detections List**(検知テーブル)には、脅威名、分類、重大度、検知日、影響を受けるデバイスの数、ステータスなどの列とともに、各脅威イベントが表示されます。行を選択すると、完全な詳細と対応アクションを含むサイドパネルが開きます。
 ### 脅威の詳細ビュー
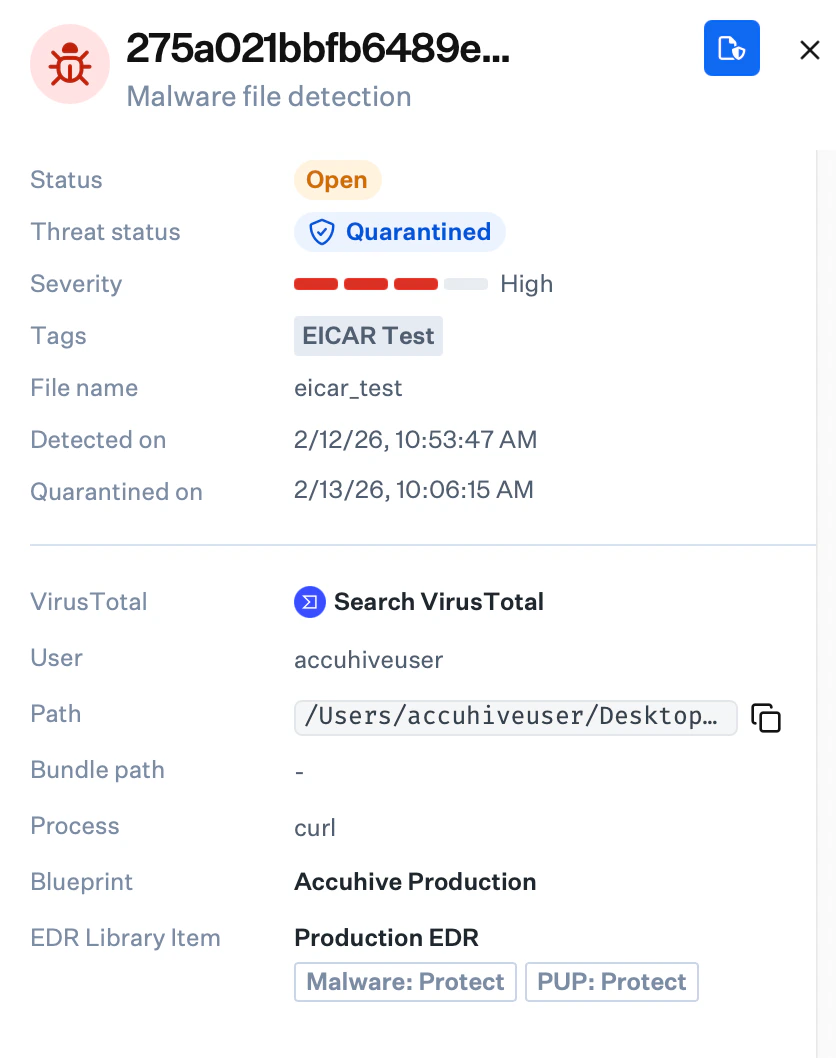
任意の脅威イベントを選択すると、検知日と隔離日、ファイルパス、ファイルハッシュ、ユーザー情報、使用可能な対応アクションを含むサイドパネルが開きます。
### 脅威の詳細ビュー
任意の脅威イベントを選択すると、検知日と隔離日、ファイルパス、ファイルハッシュ、ユーザー情報、使用可能な対応アクションを含むサイドパネルが開きます。
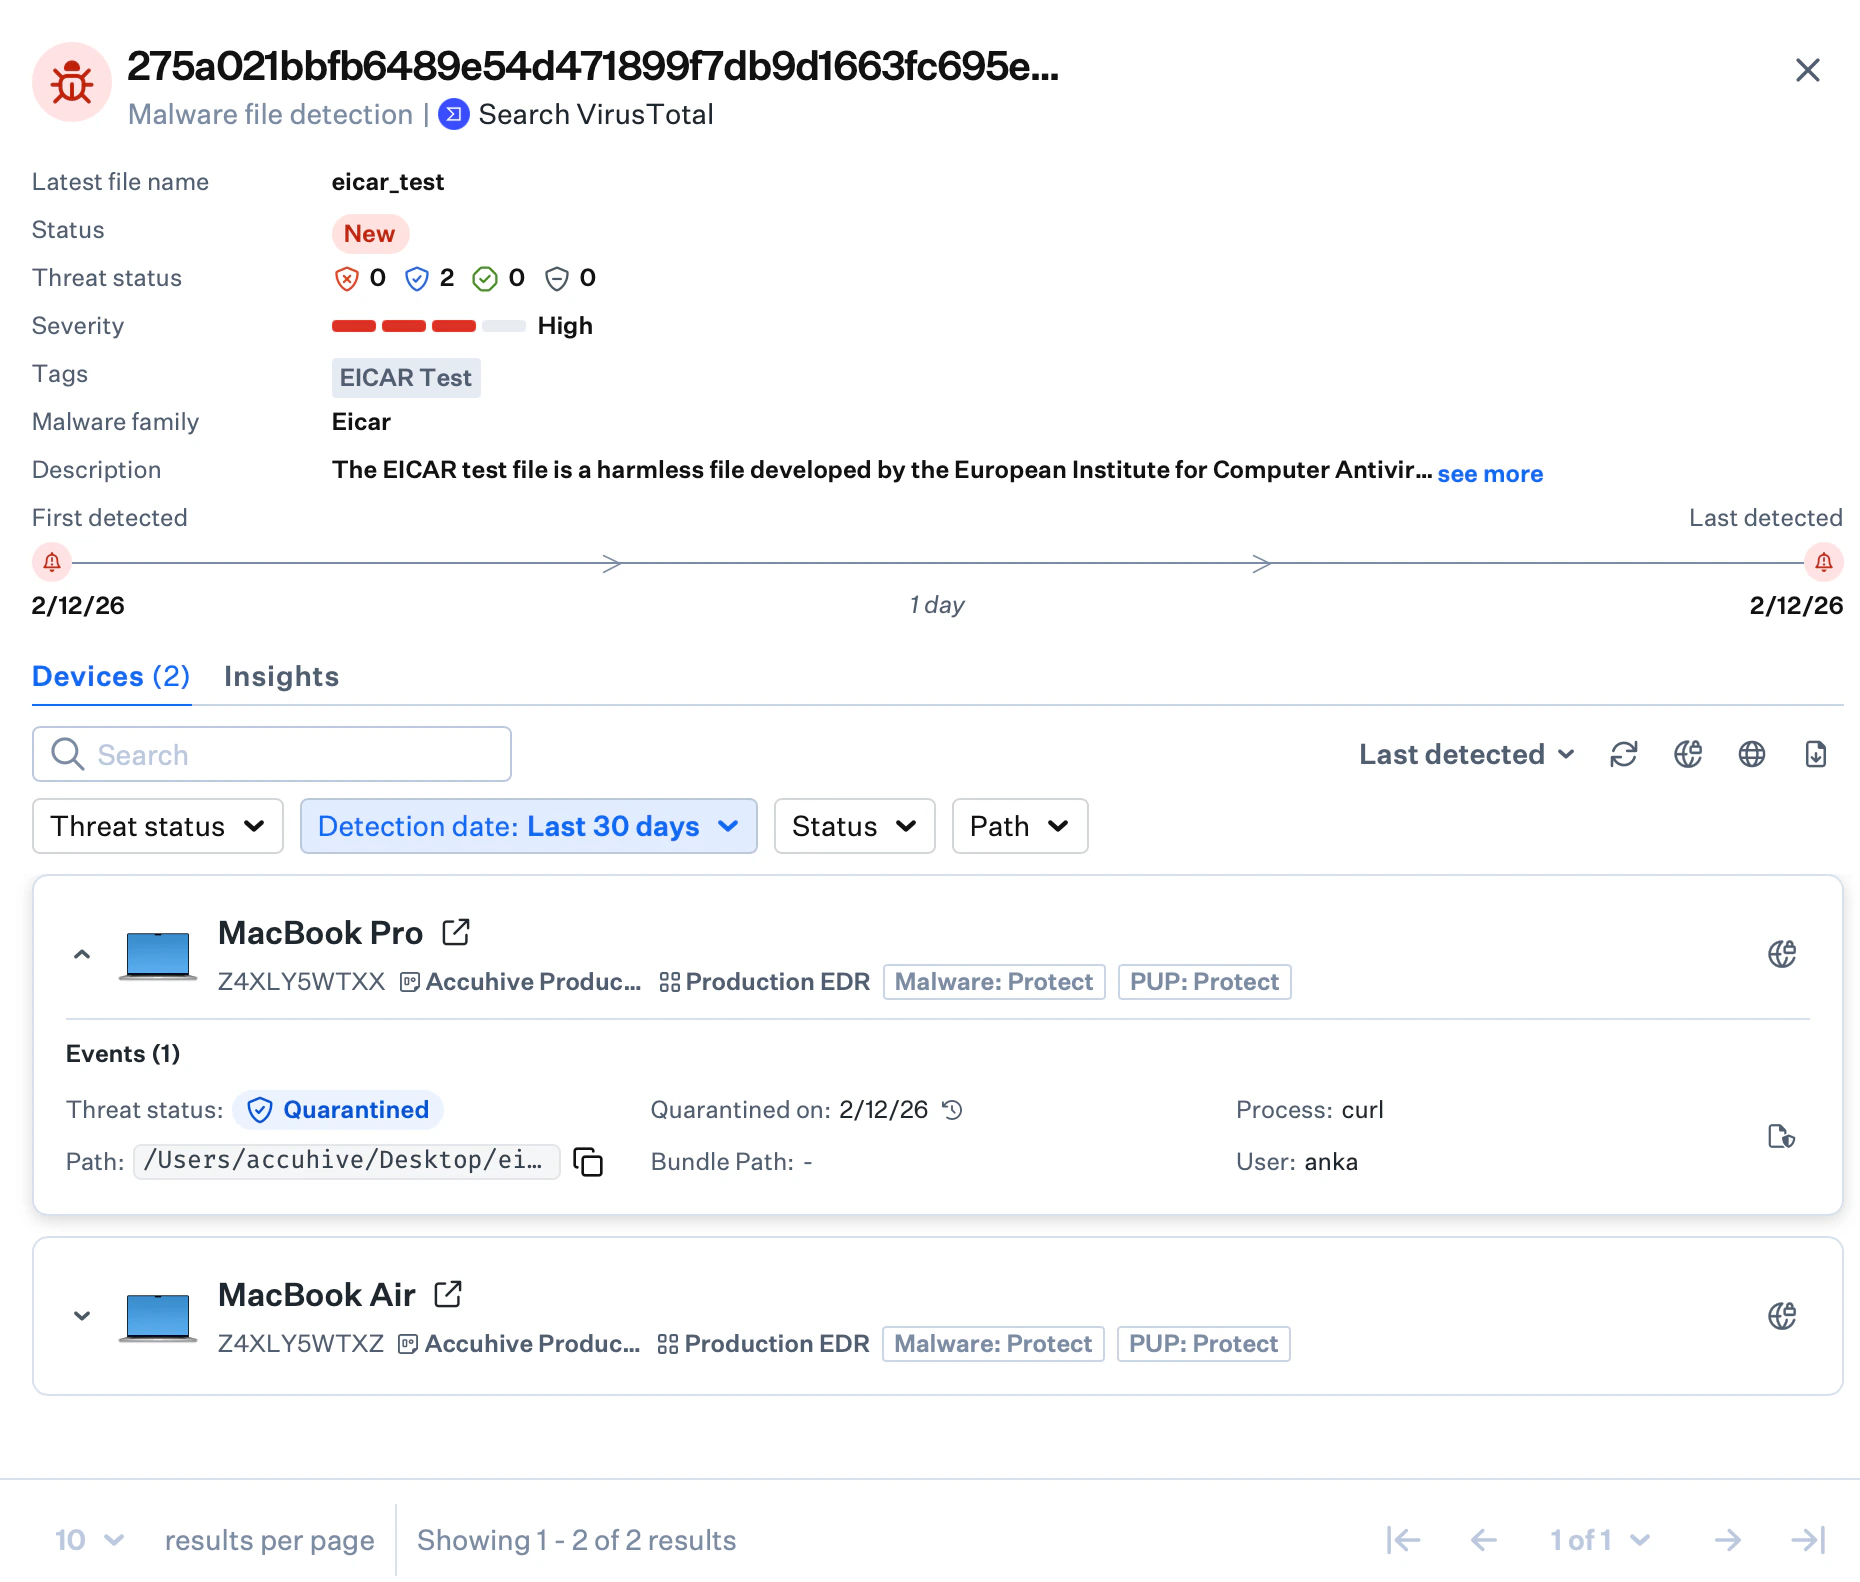 調査のワークフロー、ステータスの変更、対応アクションについては、[脅威イベントについて](/ja/endpoint/endpoint-detection-response-edr/understanding-threat-events)および [Endpoint Detection のセキュリティ運用アクション](/ja/endpoint/endpoint-detection-response-edr/security-operations-actions-in-endpoint-detection)を参照してください。
### デバイスレコードの Detections タブ
デバイスレコードのページには、特定のデバイスで見つかった脅威イベントの合計数が表示されます。実際の脅威イベントを確認するには、**検出** タブを選択します。
調査のワークフロー、ステータスの変更、対応アクションについては、[脅威イベントについて](/ja/endpoint/endpoint-detection-response-edr/understanding-threat-events)および [Endpoint Detection のセキュリティ運用アクション](/ja/endpoint/endpoint-detection-response-edr/security-operations-actions-in-endpoint-detection)を参照してください。
### デバイスレコードの Detections タブ
デバイスレコードのページには、特定のデバイスで見つかった脅威イベントの合計数が表示されます。実際の脅威イベントを確認するには、**検出** タブを選択します。
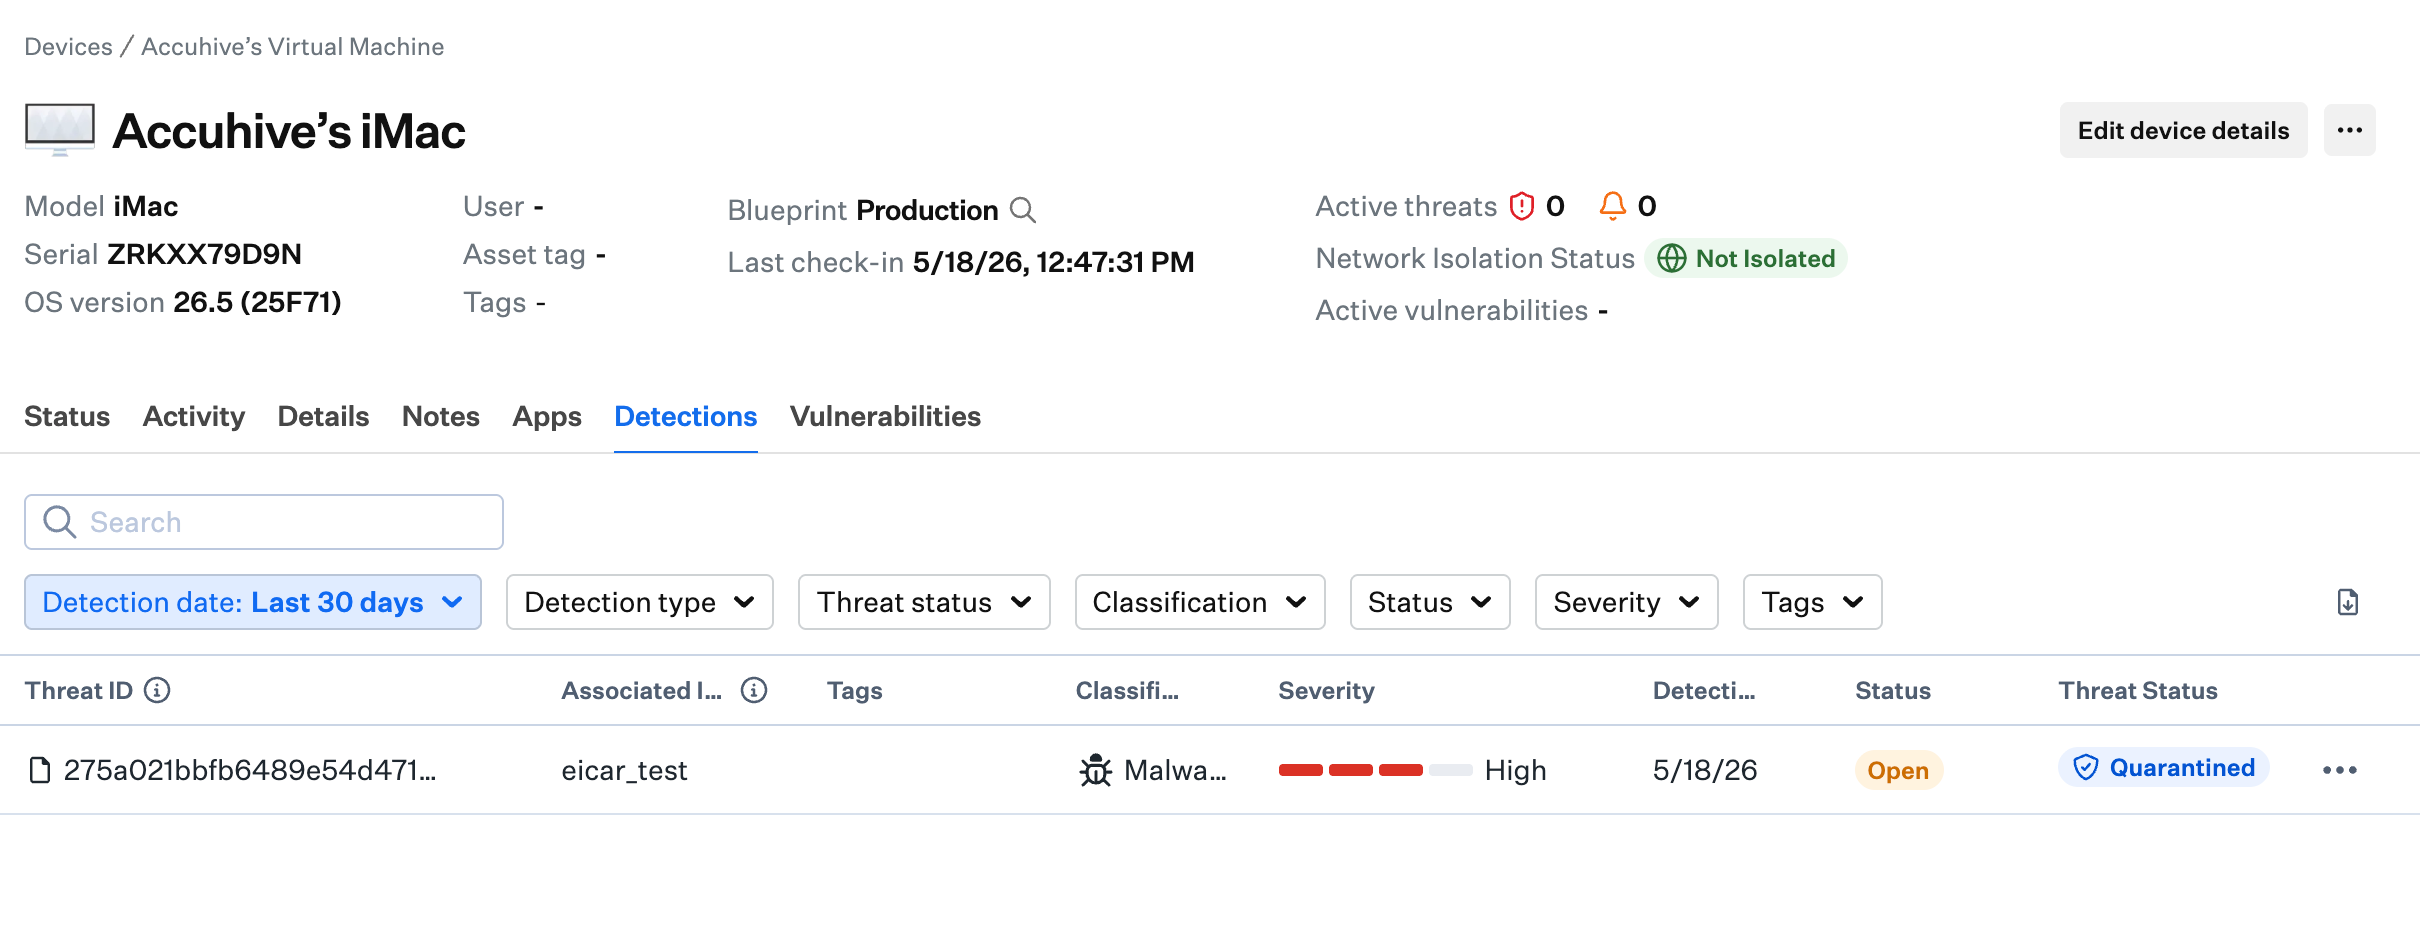 任意の脅威のエントリを選択すると、検知のタイムスタンプ、隔離日、ファイルの場所、暗号化ハッシュ、関連するユーザーアカウントが表示されます。
 デバイスビューの仕組みの詳細については、[Device Views の概要](/ja/endpoint/devices/device-views-overview)を参照してください。
### プラットフォーム固有の検知機能
Iru Endpoint EDR は、ファイル検知をマルウェア、PUP、無害、不明に分類し、振る舞い検知を悪意のあるもの、または疑わしいものに分類します。
検知テーブルの **検出タイプ** フィルタを使用して、**File detections**、**Behavioral detections**、またはその両方を表示します。
脅威の詳細のサイドパネルには、影響を受けるデバイスをネットワークから隔離するための[デバイスの隔離](/ja/endpoint/endpoint-detection-response-edr/device-isolation)機能があります。
#### Rules タブ
Detections ページの **Rules** タブでは、振る舞い検知のルールグループと検知レベルを構成できます。ここでは、グローバルなルールの検知レベルを設定するか、ルールグループごとに検知レベル(Cautious、Moderate、Aggressive)を設定でき、ルールの例外も管理できます。詳細については、[振る舞い検知ルールグループ](/ja/endpoint/endpoint-detection-response-edr/behavioral-detection-rule-groups)を参照してください。
デバイスビューの仕組みの詳細については、[Device Views の概要](/ja/endpoint/devices/device-views-overview)を参照してください。
### プラットフォーム固有の検知機能
Iru Endpoint EDR は、ファイル検知をマルウェア、PUP、無害、不明に分類し、振る舞い検知を悪意のあるもの、または疑わしいものに分類します。
検知テーブルの **検出タイプ** フィルタを使用して、**File detections**、**Behavioral detections**、またはその両方を表示します。
脅威の詳細のサイドパネルには、影響を受けるデバイスをネットワークから隔離するための[デバイスの隔離](/ja/endpoint/endpoint-detection-response-edr/device-isolation)機能があります。
#### Rules タブ
Detections ページの **Rules** タブでは、振る舞い検知のルールグループと検知レベルを構成できます。ここでは、グローバルなルールの検知レベルを設定するか、ルールグループごとに検知レベル(Cautious、Moderate、Aggressive)を設定でき、ルールの例外も管理できます。詳細については、[振る舞い検知ルールグループ](/ja/endpoint/endpoint-detection-response-edr/behavioral-detection-rule-groups)を参照してください。
 Windows の EDR は、ファイル検知をマルウェア、PUP、無害、不明に分類します。
**Classification**、**Severity**、**ステータス** のフィルタを使用して、登録済みの Windows コンピュータのマルウェアと PUP の検知を調査します。
### 次のステップ
* [脅威イベントについて](/ja/endpoint/endpoint-detection-response-edr/understanding-threat-events)
* [Endpoint Detection のセキュリティ運用アクション](/ja/endpoint/endpoint-detection-response-edr/security-operations-actions-in-endpoint-detection)
* [EDR Library Item を構成する](/ja/endpoint/endpoint-detection-response-edr/configure-the-edr-library-item)
Windows の EDR は、ファイル検知をマルウェア、PUP、無害、不明に分類します。
**Classification**、**Severity**、**ステータス** のフィルタを使用して、登録済みの Windows コンピュータのマルウェアと PUP の検知を調査します。
### 次のステップ
* [脅威イベントについて](/ja/endpoint/endpoint-detection-response-edr/understanding-threat-events)
* [Endpoint Detection のセキュリティ運用アクション](/ja/endpoint/endpoint-detection-response-edr/security-operations-actions-in-endpoint-detection)
* [EDR Library Item を構成する](/ja/endpoint/endpoint-detection-response-edr/configure-the-edr-library-item)