> ## Documentation Index
> Fetch the complete documentation index at: https://docs.iru.com/llms.txt
> Use this file to discover all available pages before exploring further.
# Understanding the Detections Page
> Navigate the Iru Endpoint Detections page. Review dashboard widgets, filters, the detections table, threat detail views, and device record detections.
This guide applies to Mac computers and Windows devices
### About the Detections Page
The **Detections** page in the Iru Endpoint Web App is where admins review threat events, monitor trends, and take response actions for devices with the EDR Library Item assigned. Access it by clicking **Detections** in the left-hand navigation bar (under **Endpoint**).
For an overview of EDR capabilities and posture modes, see [Endpoint Detection & Response (EDR) Overview](/en/endpoint/endpoint-detection-response-edr/endpoint-detection-and-response-edr-overview).
### Dashboard Widgets
#### Detections Over Time
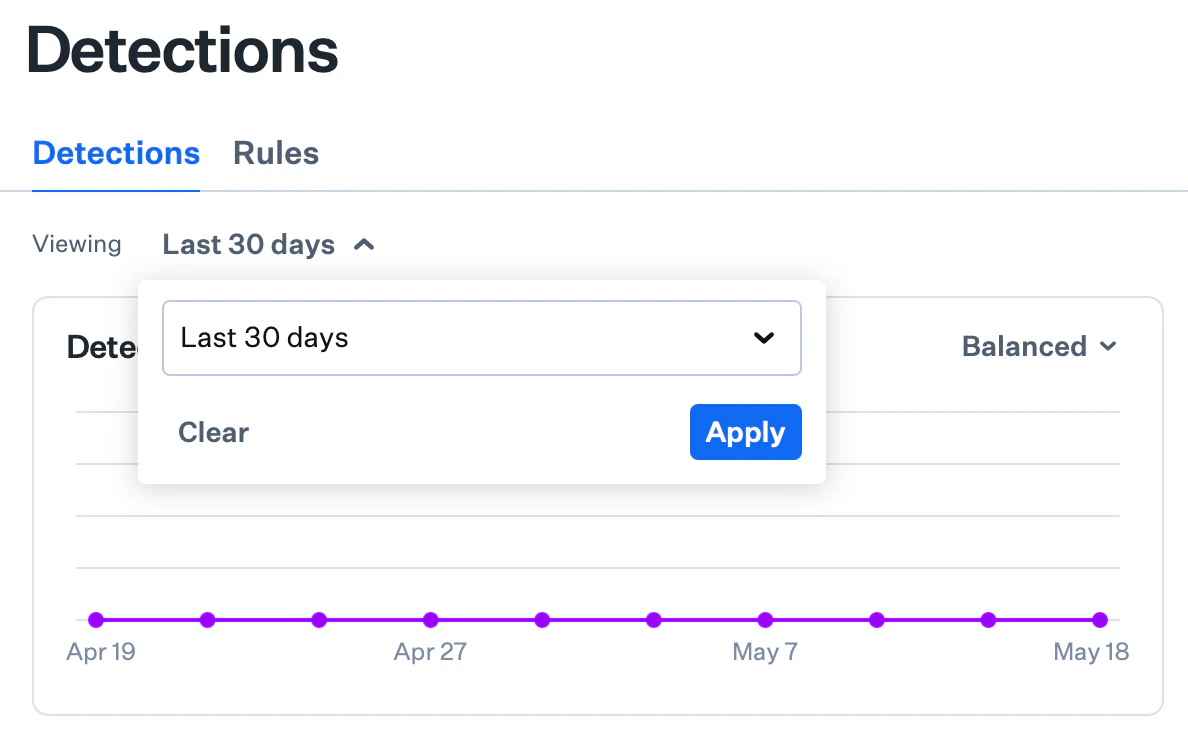
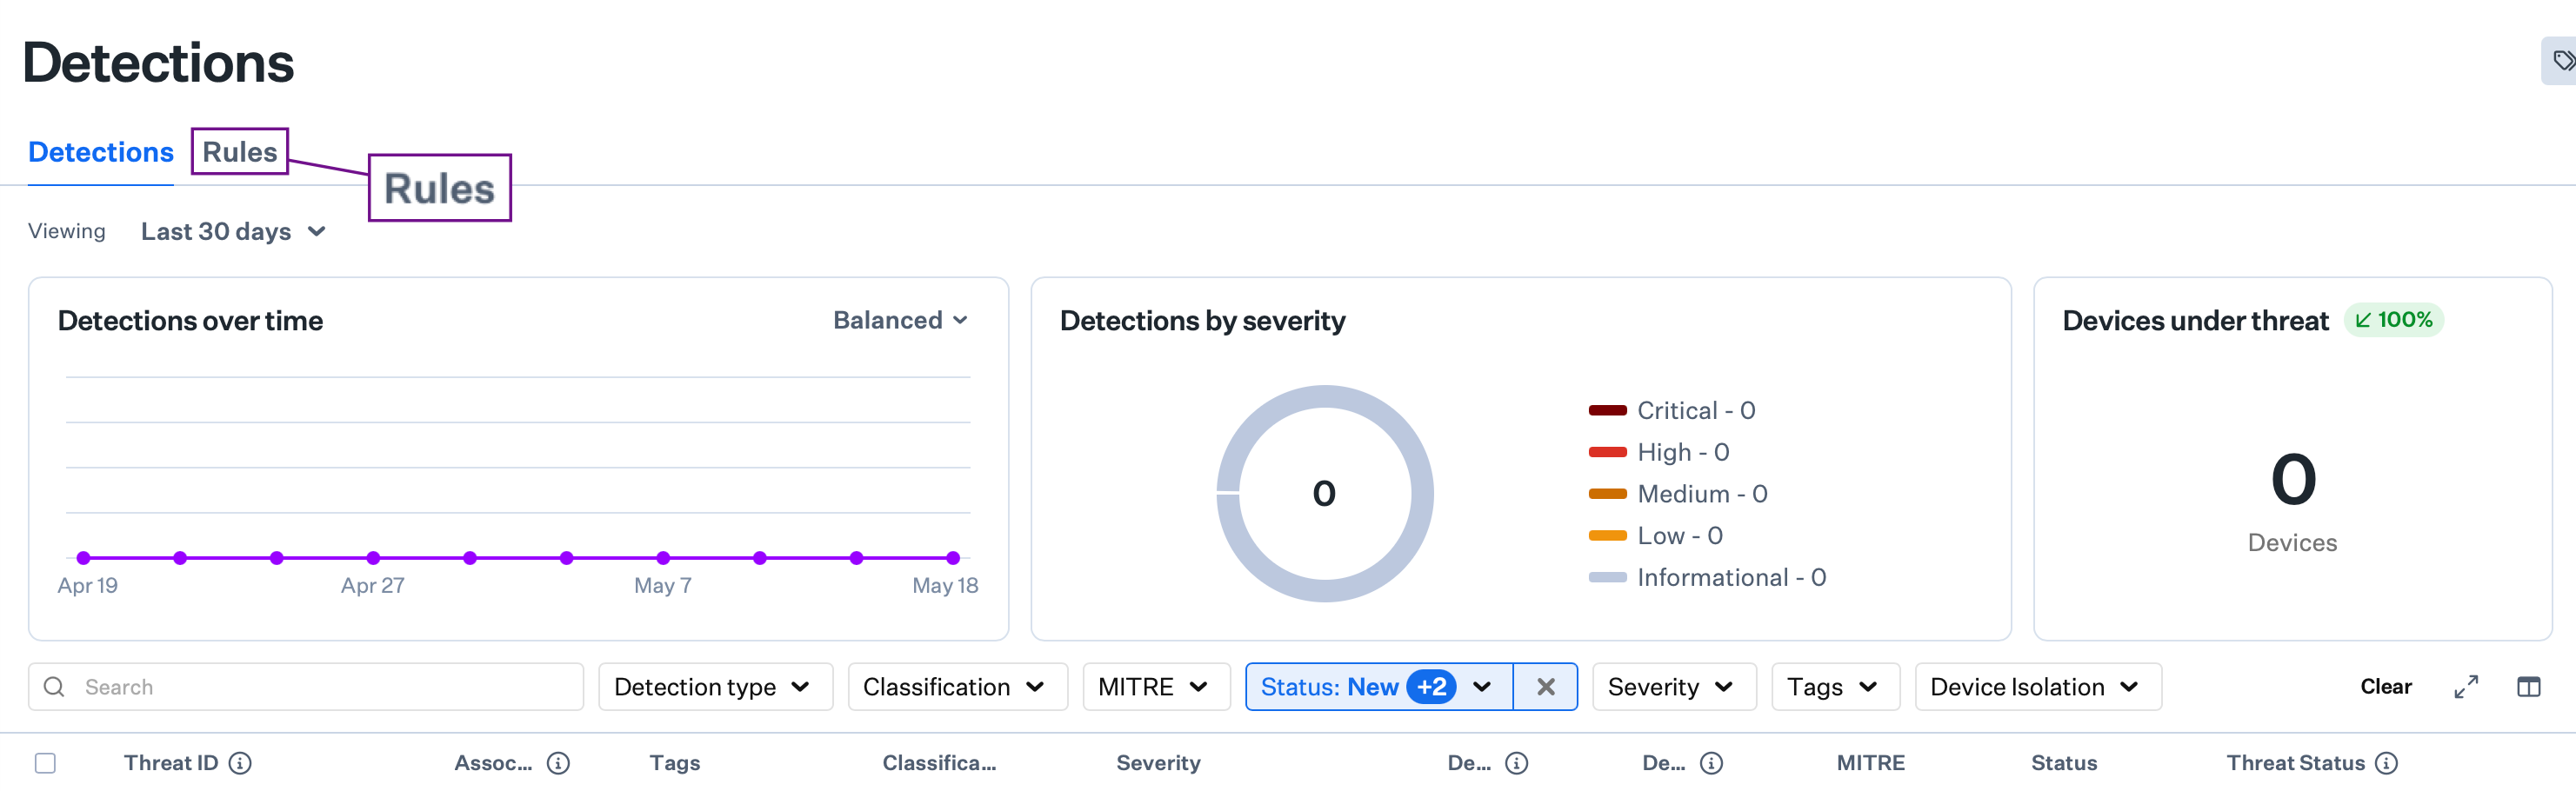
The **Detections Over Time** graph displays a chronological overview of security threats detected within a specified timeframe. By default, the graph shows data for the past 30 days. At the top of the **Detections** tab, click the date range beside **Viewing** (default **Last 30 days**) to change the period, such as **Last 24 hours** through **Last 90 days**, **All time**, or **Custom date range**.
If you choose a date range exceeding 90 days, the system automatically limits the display to 90 days.
The graph offers three visualization options:
* **Granular** — Shows every individual threat detection
* **Smooth** — Displays general trends and patterns
* **Balanced** — Default setting between detailed data and trend visualization
 #### Detections By Severity
The **Detections By Severity** view provides a visual breakdown of detections by severity level. Each detection is assigned one of five severity levels: Critical, High, Medium, Low, and Informational.
#### Detections By Severity
The **Detections By Severity** view provides a visual breakdown of detections by severity level. Each detection is assigned one of five severity levels: Critical, High, Medium, Low, and Informational.
 #### Devices Under Threat
The **Devices Under Threat** metric shows how many devices currently have active security threats. Adjust the timeframe using the date range at the top of the page. This data refreshes each time the page is loaded.
#### Devices Under Threat
The **Devices Under Threat** metric shows how many devices currently have active security threats. Adjust the timeframe using the date range at the top of the page. This data refreshes each time the page is loaded.
 #### Filter by Date Range
On the **Detections** tab, click the date range at the top of the page to choose how far back threat events appear. The current range is shown to the right of **Viewing** and defaults to **Last 30 days**. Select a preset (**Last 24 hours**, **Last 7 days**, **Last 30 days**, **Last 60 days**, **Last 90 days**, or **All time**) or **Custom date range** for specific start and end dates. Your selection applies to the dashboard widgets and the detections table.
#### Filter by Date Range
On the **Detections** tab, click the date range at the top of the page to choose how far back threat events appear. The current range is shown to the right of **Viewing** and defaults to **Last 30 days**. Select a preset (**Last 24 hours**, **Last 7 days**, **Last 30 days**, **Last 60 days**, **Last 90 days**, or **All time**) or **Custom date range** for specific start and end dates. Your selection applies to the dashboard widgets and the detections table.
 ### Search, Filters, and the Detections Table
Above the detections table, use **Search** and the filter dropdowns to narrow the list by detection type, classification, status, severity, and other criteria.
### Search, Filters, and the Detections Table
Above the detections table, use **Search** and the filter dropdowns to narrow the list by detection type, classification, status, severity, and other criteria.
 The **Detections List** (detections table) shows each threat event with columns such as threat name, classification, severity, detection date, number of affected devices, and status. Click a row to open the side panel with full details and response actions.
 ### Threat Detail View
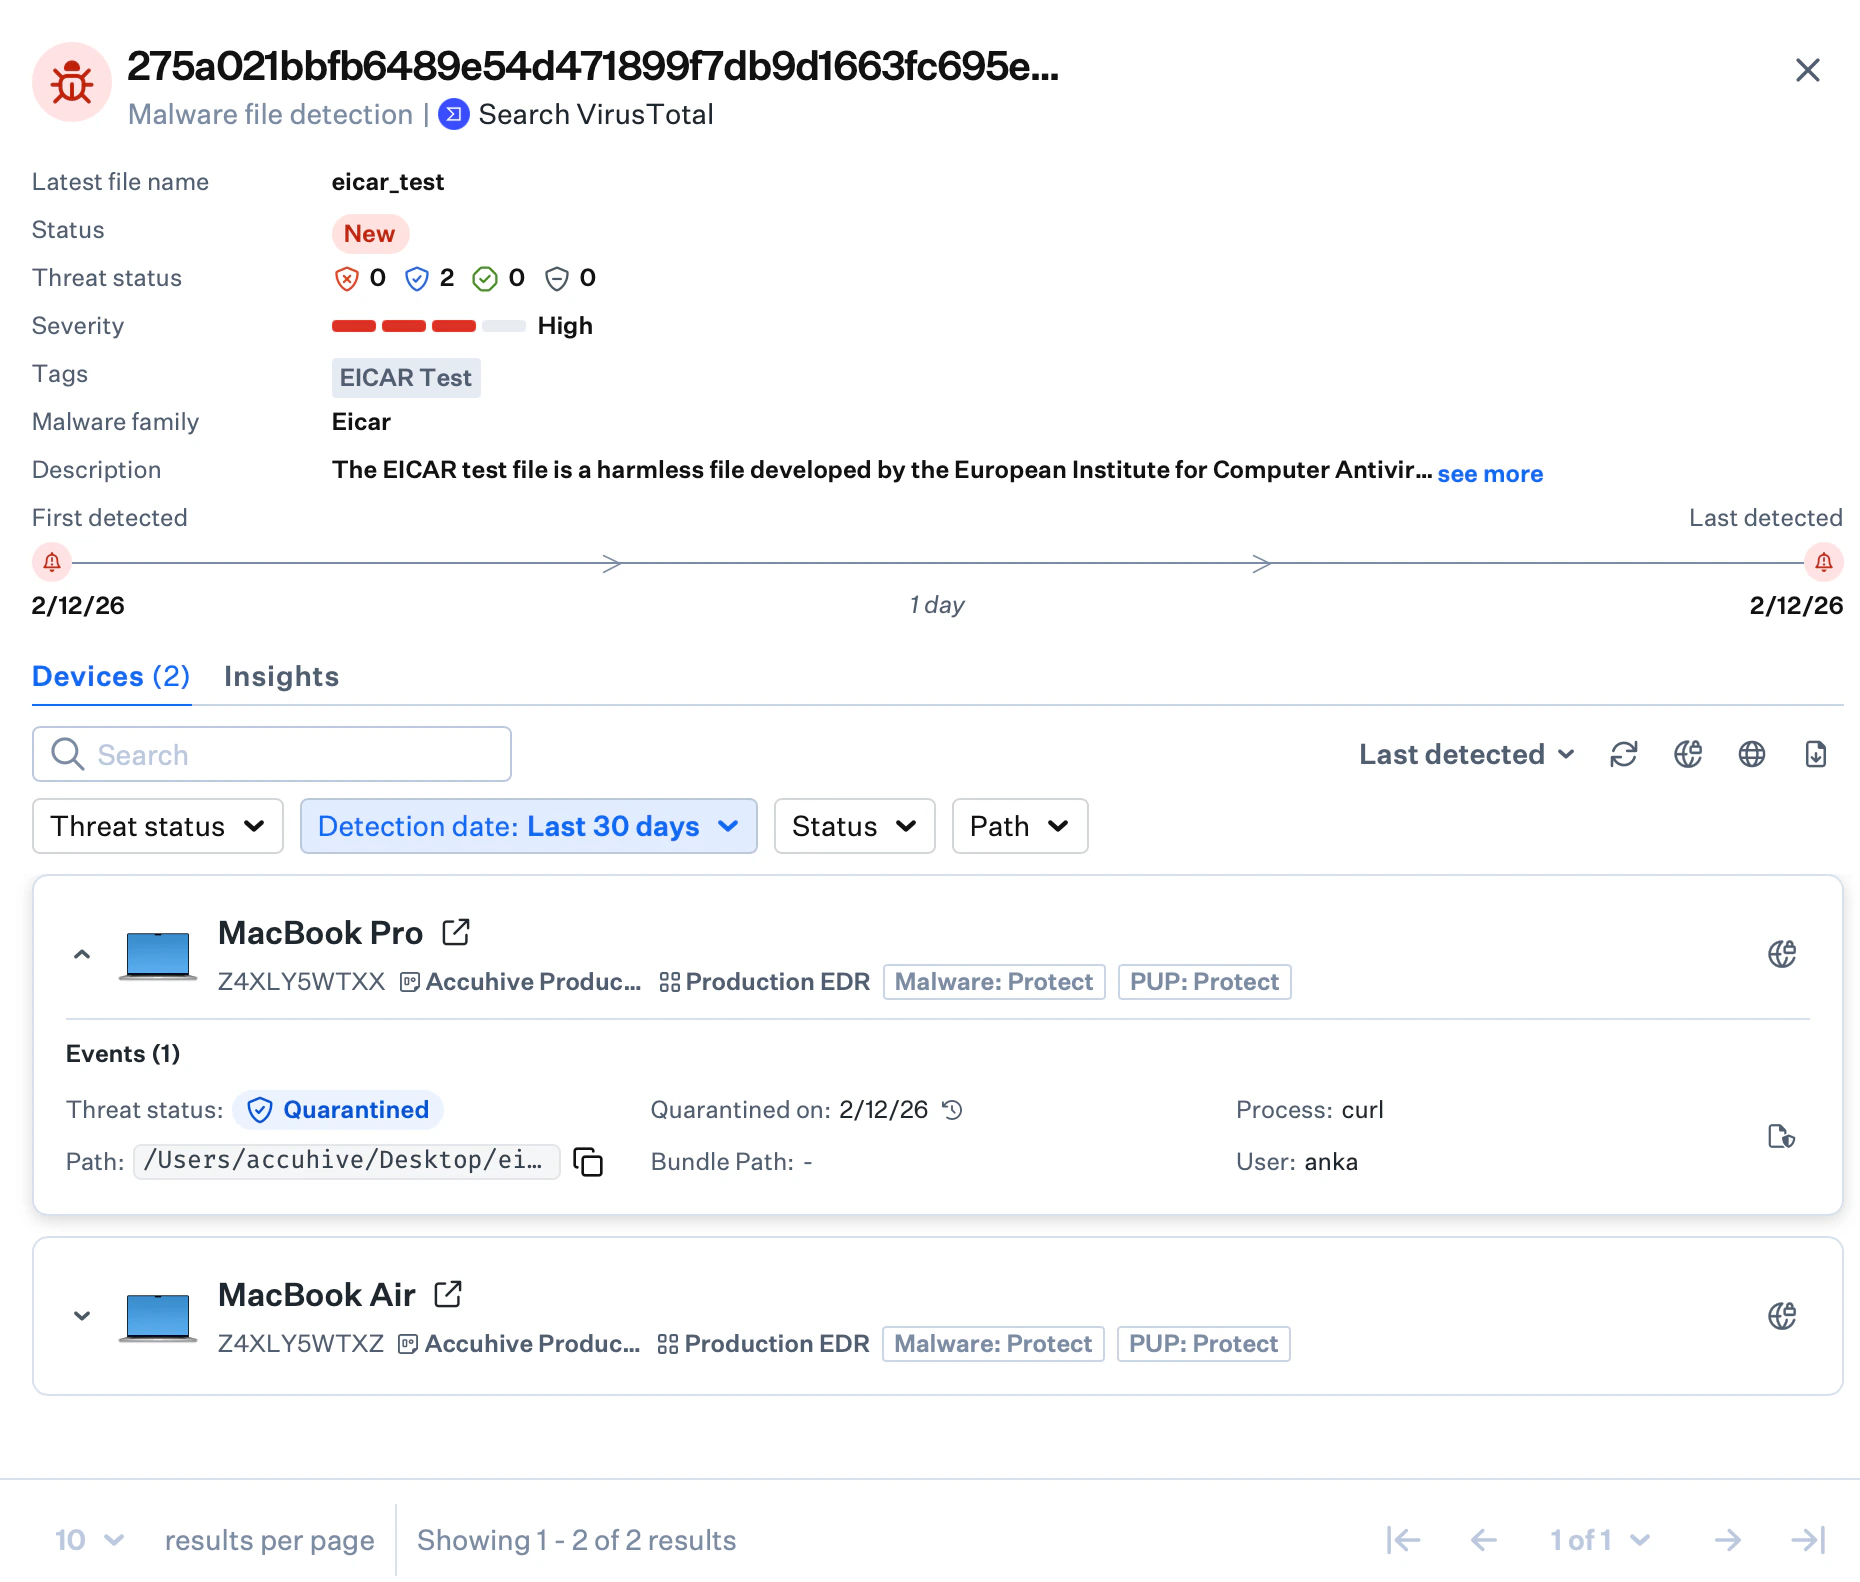
Click any threat event to open a side panel with detection and quarantine dates, file path, file hash, user information, and available response actions.
### Threat Detail View
Click any threat event to open a side panel with detection and quarantine dates, file path, file hash, user information, and available response actions.
 For investigation workflows, status changes, and response actions, see [Understanding Threat Events](/en/endpoint/endpoint-detection-response-edr/understanding-threat-events) and [Security Operations Actions in Endpoint Detection](/en/endpoint/endpoint-detection-response-edr/security-operations-actions-in-endpoint-detection).
### Device Record Detections Tab
The device record page shows the total number of threat events found on a specific device. To see the actual threat events, select the **Detections** tab.
For investigation workflows, status changes, and response actions, see [Understanding Threat Events](/en/endpoint/endpoint-detection-response-edr/understanding-threat-events) and [Security Operations Actions in Endpoint Detection](/en/endpoint/endpoint-detection-response-edr/security-operations-actions-in-endpoint-detection).
### Device Record Detections Tab
The device record page shows the total number of threat events found on a specific device. To see the actual threat events, select the **Detections** tab.
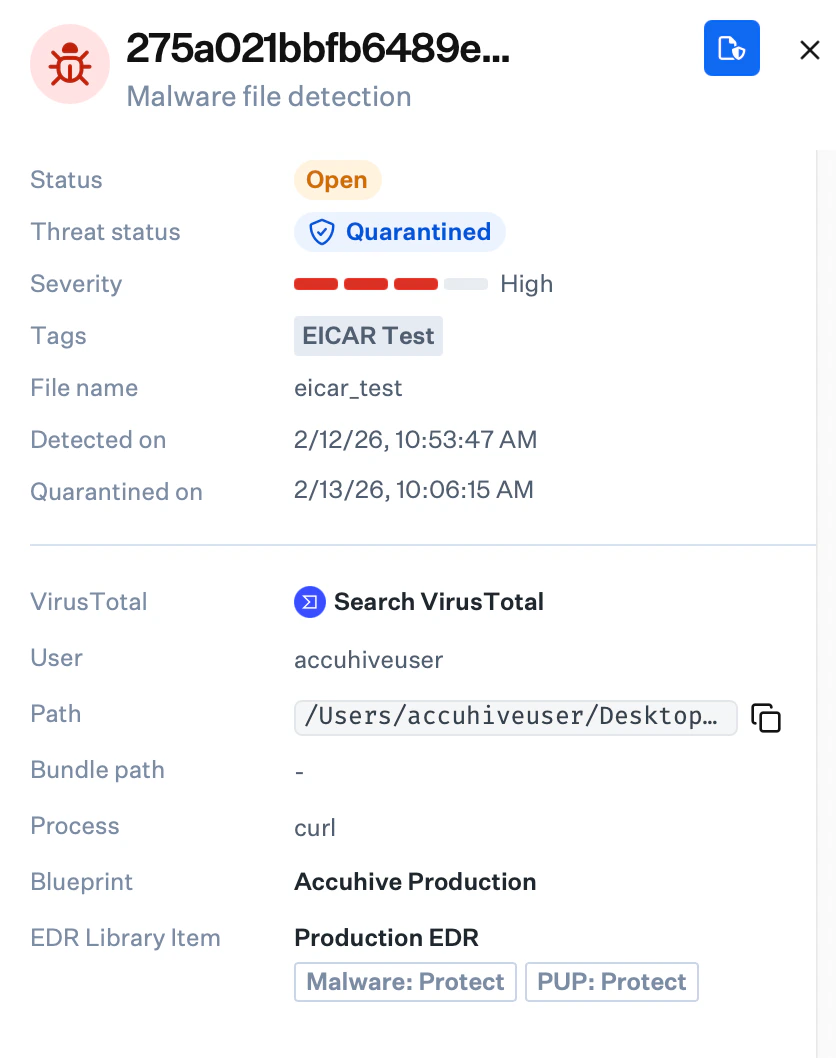
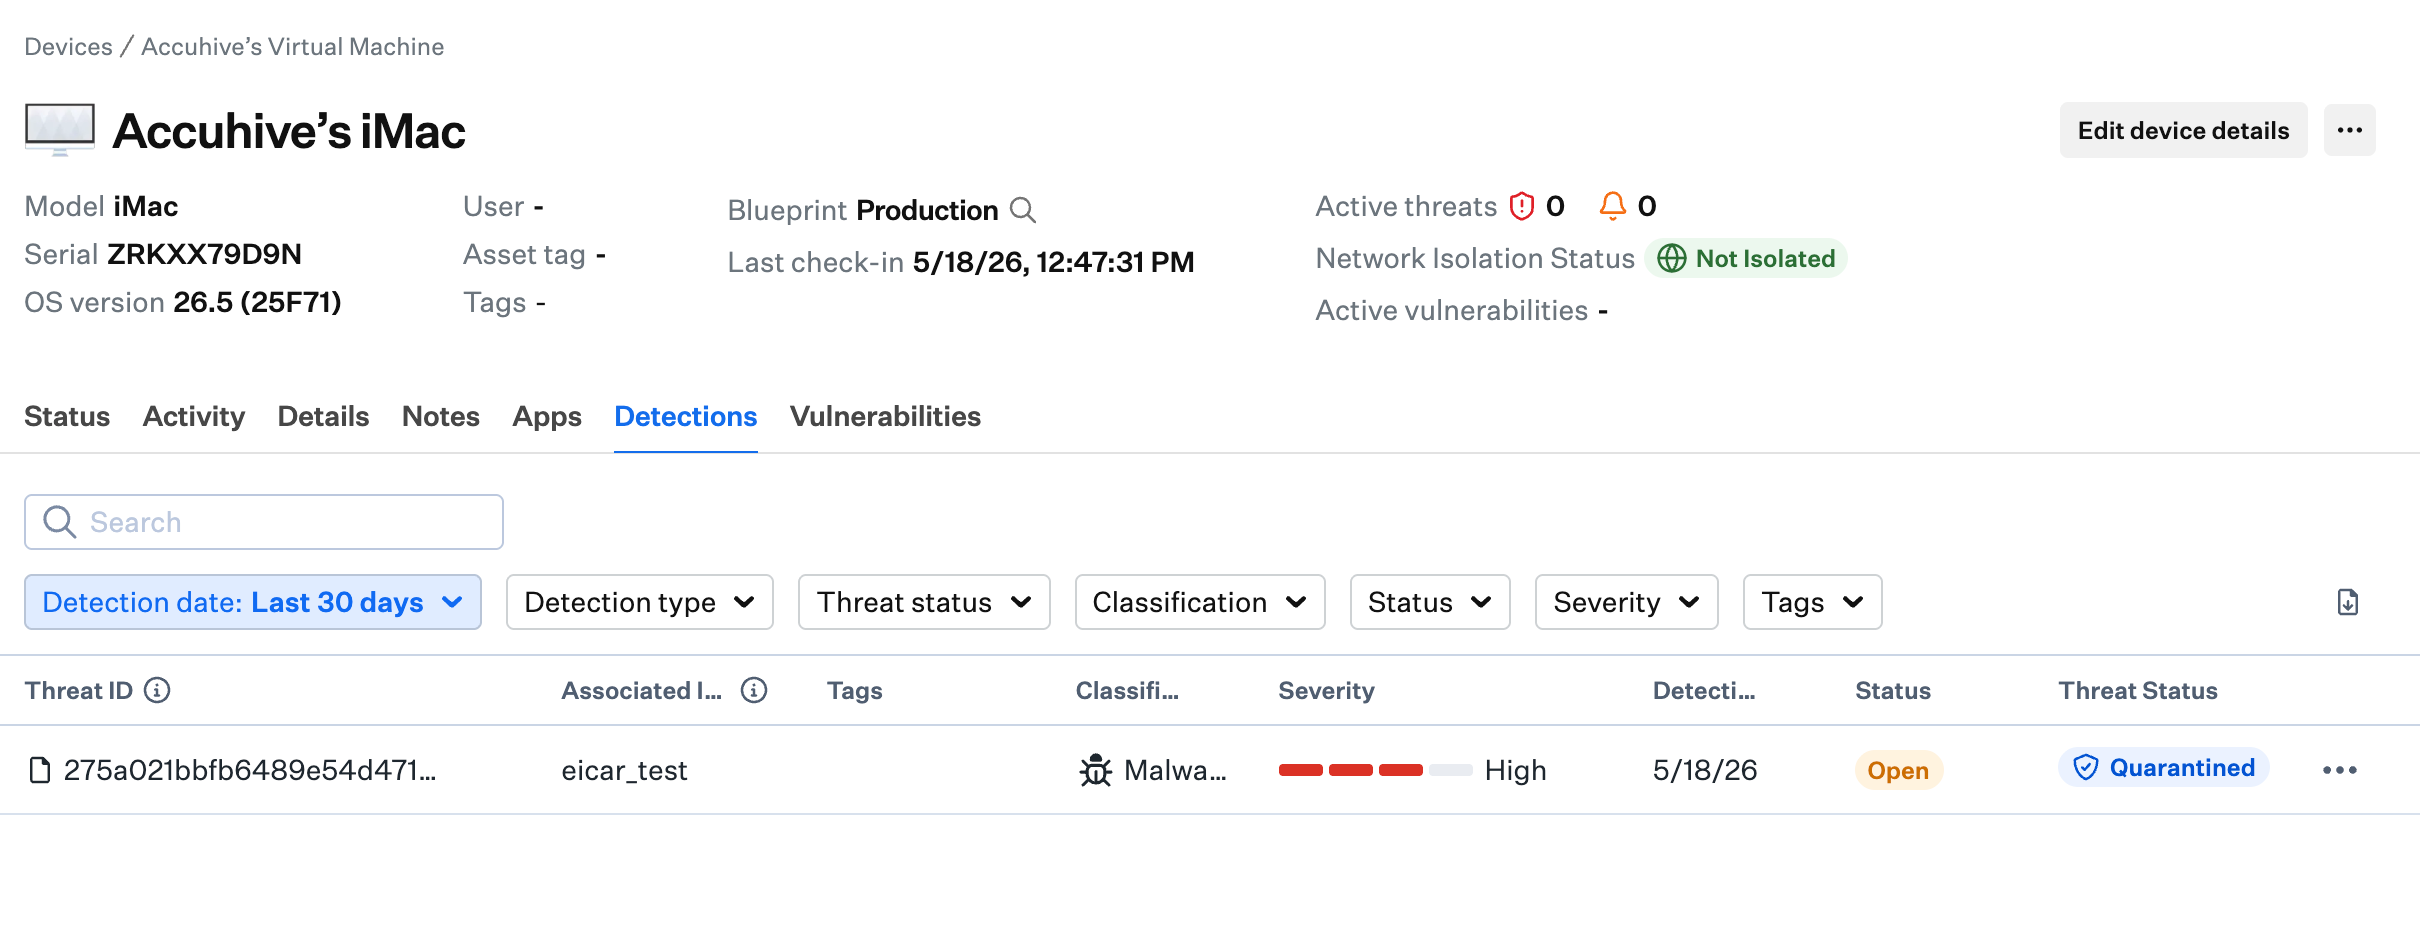 Select any threat entry to display comprehensive details including detection timestamp, quarantine date, file location, cryptographic hash, and related user account information.
 For more details about how device views work, see [Device Views Overview](/en/endpoint/devices/device-views-overview).
### Platform-Specific Detections Features
Iru Endpoint EDR categorizes file detections as malware, PUPs, benign, or unknown, and behavioral detections as malicious or suspicious.
Use the **Detection type** filter on the detections table to show **File detections**, **Behavioral detections**, or both.
The threat detail side panel provides [device isolation](/en/endpoint/endpoint-detection-response-edr/device-isolation) for quarantining affected devices from the network.
#### Rules Tab
The **Rules** tab on the Detections page lets you configure behavioral detection rule groups and detection levels. From here you can set a global rule detection level or set detection levels per rule group (Cautious, Moderate, or Aggressive), and manage rule exceptions. For full details, see [Behavioral Detection Rule Groups](/en/endpoint/endpoint-detection-response-edr/behavioral-detection-rule-groups).
For more details about how device views work, see [Device Views Overview](/en/endpoint/devices/device-views-overview).
### Platform-Specific Detections Features
Iru Endpoint EDR categorizes file detections as malware, PUPs, benign, or unknown, and behavioral detections as malicious or suspicious.
Use the **Detection type** filter on the detections table to show **File detections**, **Behavioral detections**, or both.
The threat detail side panel provides [device isolation](/en/endpoint/endpoint-detection-response-edr/device-isolation) for quarantining affected devices from the network.
#### Rules Tab
The **Rules** tab on the Detections page lets you configure behavioral detection rule groups and detection levels. From here you can set a global rule detection level or set detection levels per rule group (Cautious, Moderate, or Aggressive), and manage rule exceptions. For full details, see [Behavioral Detection Rule Groups](/en/endpoint/endpoint-detection-response-edr/behavioral-detection-rule-groups).
 Windows EDR categorizes file detections as malware, PUPs, benign, or unknown.
Use the **Classification**, **Severity**, and **Status** filters to investigate malware and PUP detections on enrolled Windows devices.
### Next Steps
* [Understanding Threat Events](/en/endpoint/endpoint-detection-response-edr/understanding-threat-events)
* [Security Operations Actions in Endpoint Detection](/en/endpoint/endpoint-detection-response-edr/security-operations-actions-in-endpoint-detection)
* [Configure the EDR Library Item](/en/endpoint/endpoint-detection-response-edr/configure-the-edr-library-item)
Windows EDR categorizes file detections as malware, PUPs, benign, or unknown.
Use the **Classification**, **Severity**, and **Status** filters to investigate malware and PUP detections on enrolled Windows devices.
### Next Steps
* [Understanding Threat Events](/en/endpoint/endpoint-detection-response-edr/understanding-threat-events)
* [Security Operations Actions in Endpoint Detection](/en/endpoint/endpoint-detection-response-edr/security-operations-actions-in-endpoint-detection)
* [Configure the EDR Library Item](/en/endpoint/endpoint-detection-response-edr/configure-the-edr-library-item)